
Christmas Sales Part 2
With more results announced, we can see that Christmas has produced some pleasant surprises and, as last year, some impressive total sales changes, driven mostly by online.
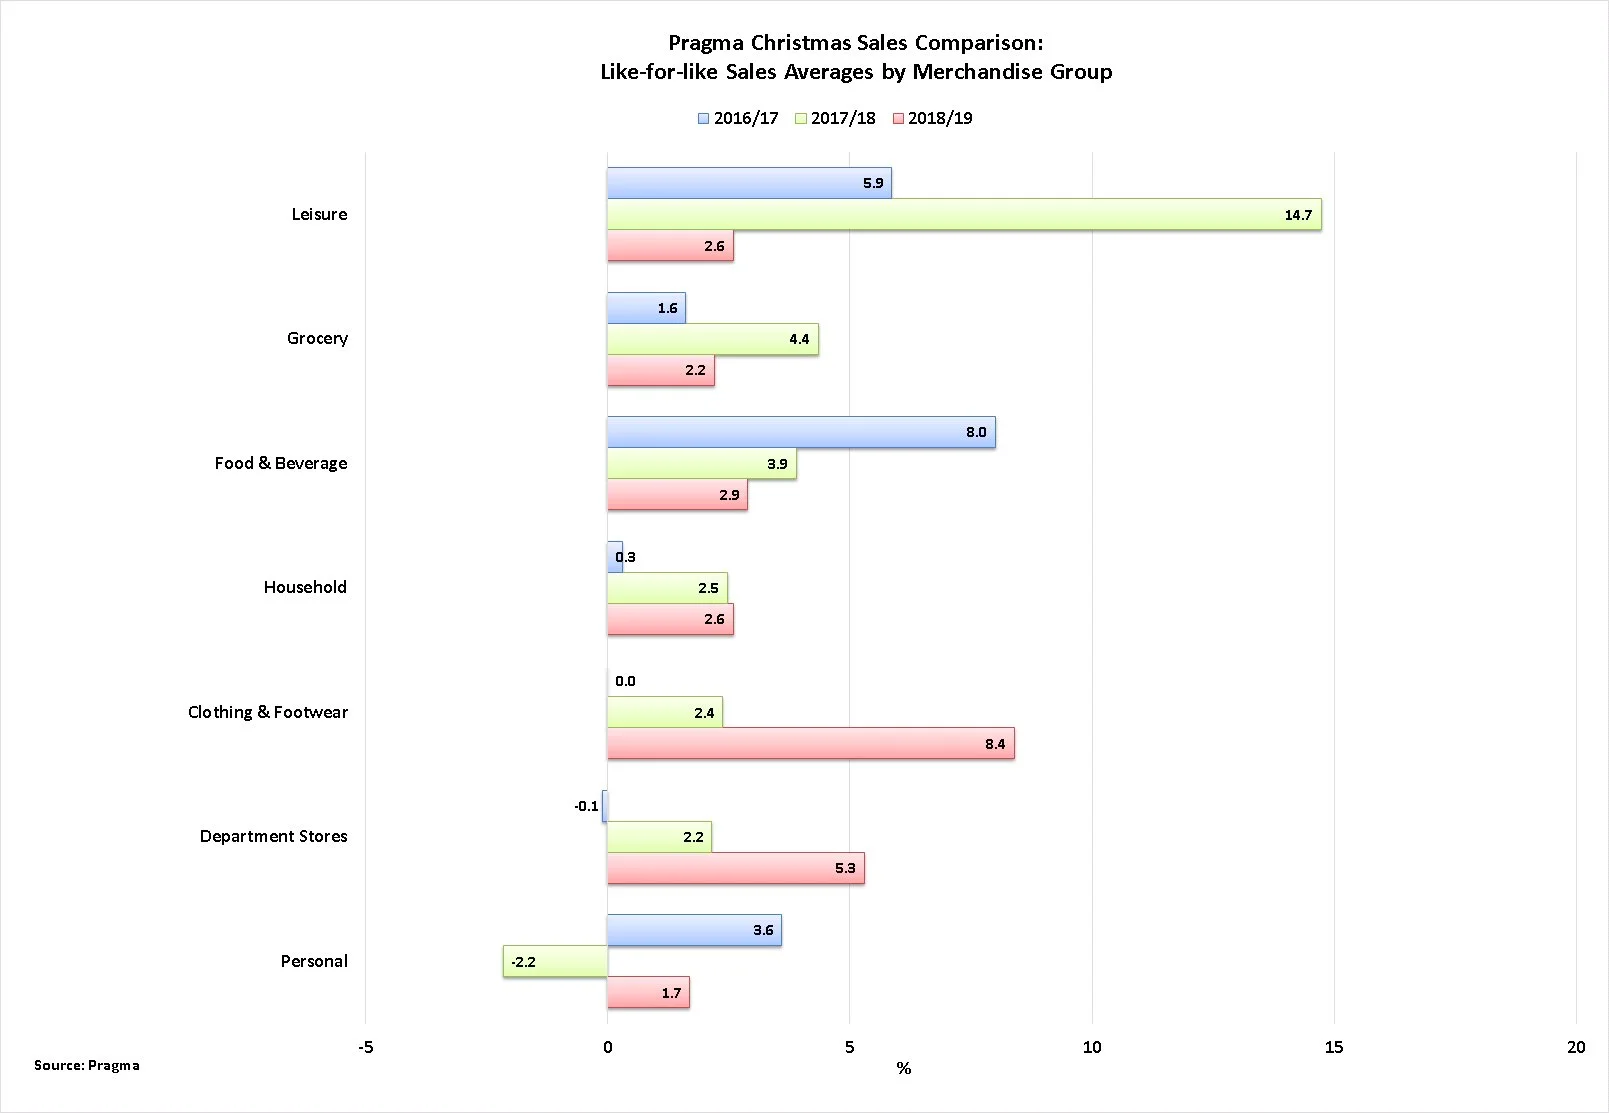
Like-for-Like Averages by Group
All Retailers

Individual Merchandise Groups
This edition of the Pragma Christmas Sales Report breaks down the retailers into their Merchandise Groups.
Clothing & Footwear

Food

F&B

Department Stores

Personal Goods

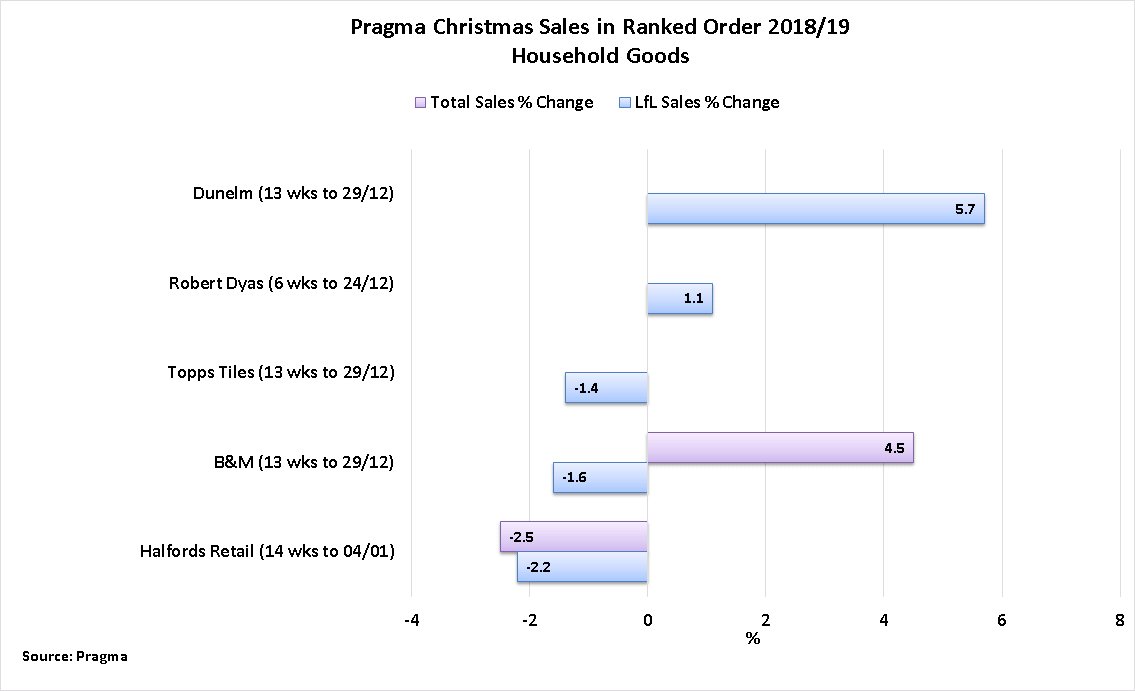
Household Goods
Leisure Goods

Online Sales

3-year Comparison

Pragma’s 3 year like-for-like comparison graph shows how fortunes can change.
Christmas Casualties

Pragma records Christmas casualties as those who fall during the key period of 22 December to end of January. So far, this Christmas has seen HMV and Greenwoods hit the buffers. Cookware retailer Steamer Trading was placed into administration and subsequently rescued by ProCook.
The number of retailers recorded on SnapShop entering administration across the whole of each of the past 10 years is:
· 2018 – 33
· 2017 – 18
· 2016 – 13
· 2015 – 4
· 2014 – 9
· 2013 – 43
· 2012 – 44
· 2011 – 57
· 2010 – 42
· 2009 - 93
Future Editions & Methodology
The Pragma Christmas Sales Report will be updated throughout January.
Pragma Christmas Sales Reporting Methodology
Pragma seeks to gain an accurate review of the Christmas period; hence the period end date must be at least Christmas Eve and no later than the end of January; the period must be 13 weeks or less
Sales are quoted by the retailers with Total Sales invariably including Online, unless for a specific division, and Like-for-Like being for comparable stores
Online Sales, where quoted as a separate figure, are always shown as Total changes
Graphs are ranked in order, highest to lowest, first by Like-for-Like change, then by Total change
Pragma has gone to its best efforts to ensure this data is correct, but the author reserves the right not to be responsible for the accuracy of the information provided.
Pragma clients with access to SnapShop can find out about all retailers mentioned by logging on at www.snap-shop.co.uk
Otherwise, contact us to find out what we know about retailers and how we can help you.